Ocean Evidence CommonsEconomic impact, with the receipts
Staff workspace
U.S. IOOS ECONOMIC EVIDENCE

See how ocean data becomes public value.

Explore the evidence behind better decisions at sea and along the coast. Every finding is traceable to its source, review status, and limits.
Read our methodology →
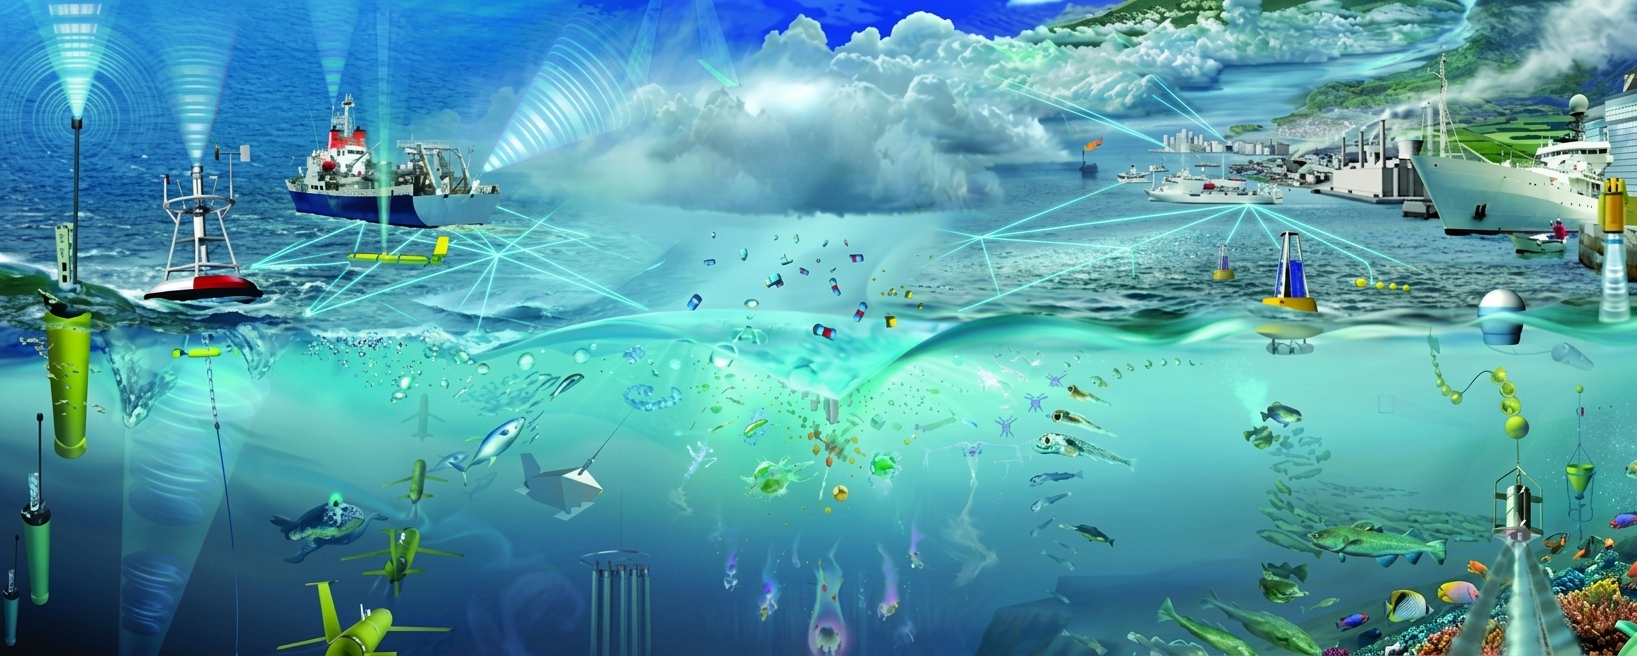
Illustrated ocean observing system showing ships, buoys, autonomous vehicles, marine life, ports, and coastal communities
Evidence snapshotNational hub
151

verified economic evidence records

31distinct sources
8impact domains
9regional partners with data
Live from the Supabase evidence repository
TraceableOriginal source on every claim
ConservativeEconomic activity ≠ attributable benefit
Status-awareDraft and verified evidence stay distinct
Usable nowDraft metrics remain available for exploration
DOCUMENTED VALUE

Different studies. One recurring signal.

These estimates cover different places, years, and methods. They should not be added together—but each shows how better ocean information can change consequential decisions.

01 / 03$217.4Mmodeled annual benefit

Safer, more efficient port navigation

Estimated across 58 U.S. ports served by NOAA PORTS.

FROM OCEAN TO OUTCOME

Value is created when information changes a decision.

Follow the chain to see where sustained observing becomes practical public value.

01
Observe

Buoys, radar, gliders, satellites, and field sampling measure changing ocean conditions.

EVIDENCE LANDSCAPE

See where the evidence is taking shape.

Explore current coverage by outcome or regional partner. Longer bars and larger circles represent more evidence records in the live repository.

Evidence by outcome

Regional footprint

Current evidence   Collection opportunity

THE SYSTEM BEHIND THE EVIDENCE

Ocean intelligence starts with observation.

IOOS connects regional observing networks, forecasting tools, and people making consequential decisions.
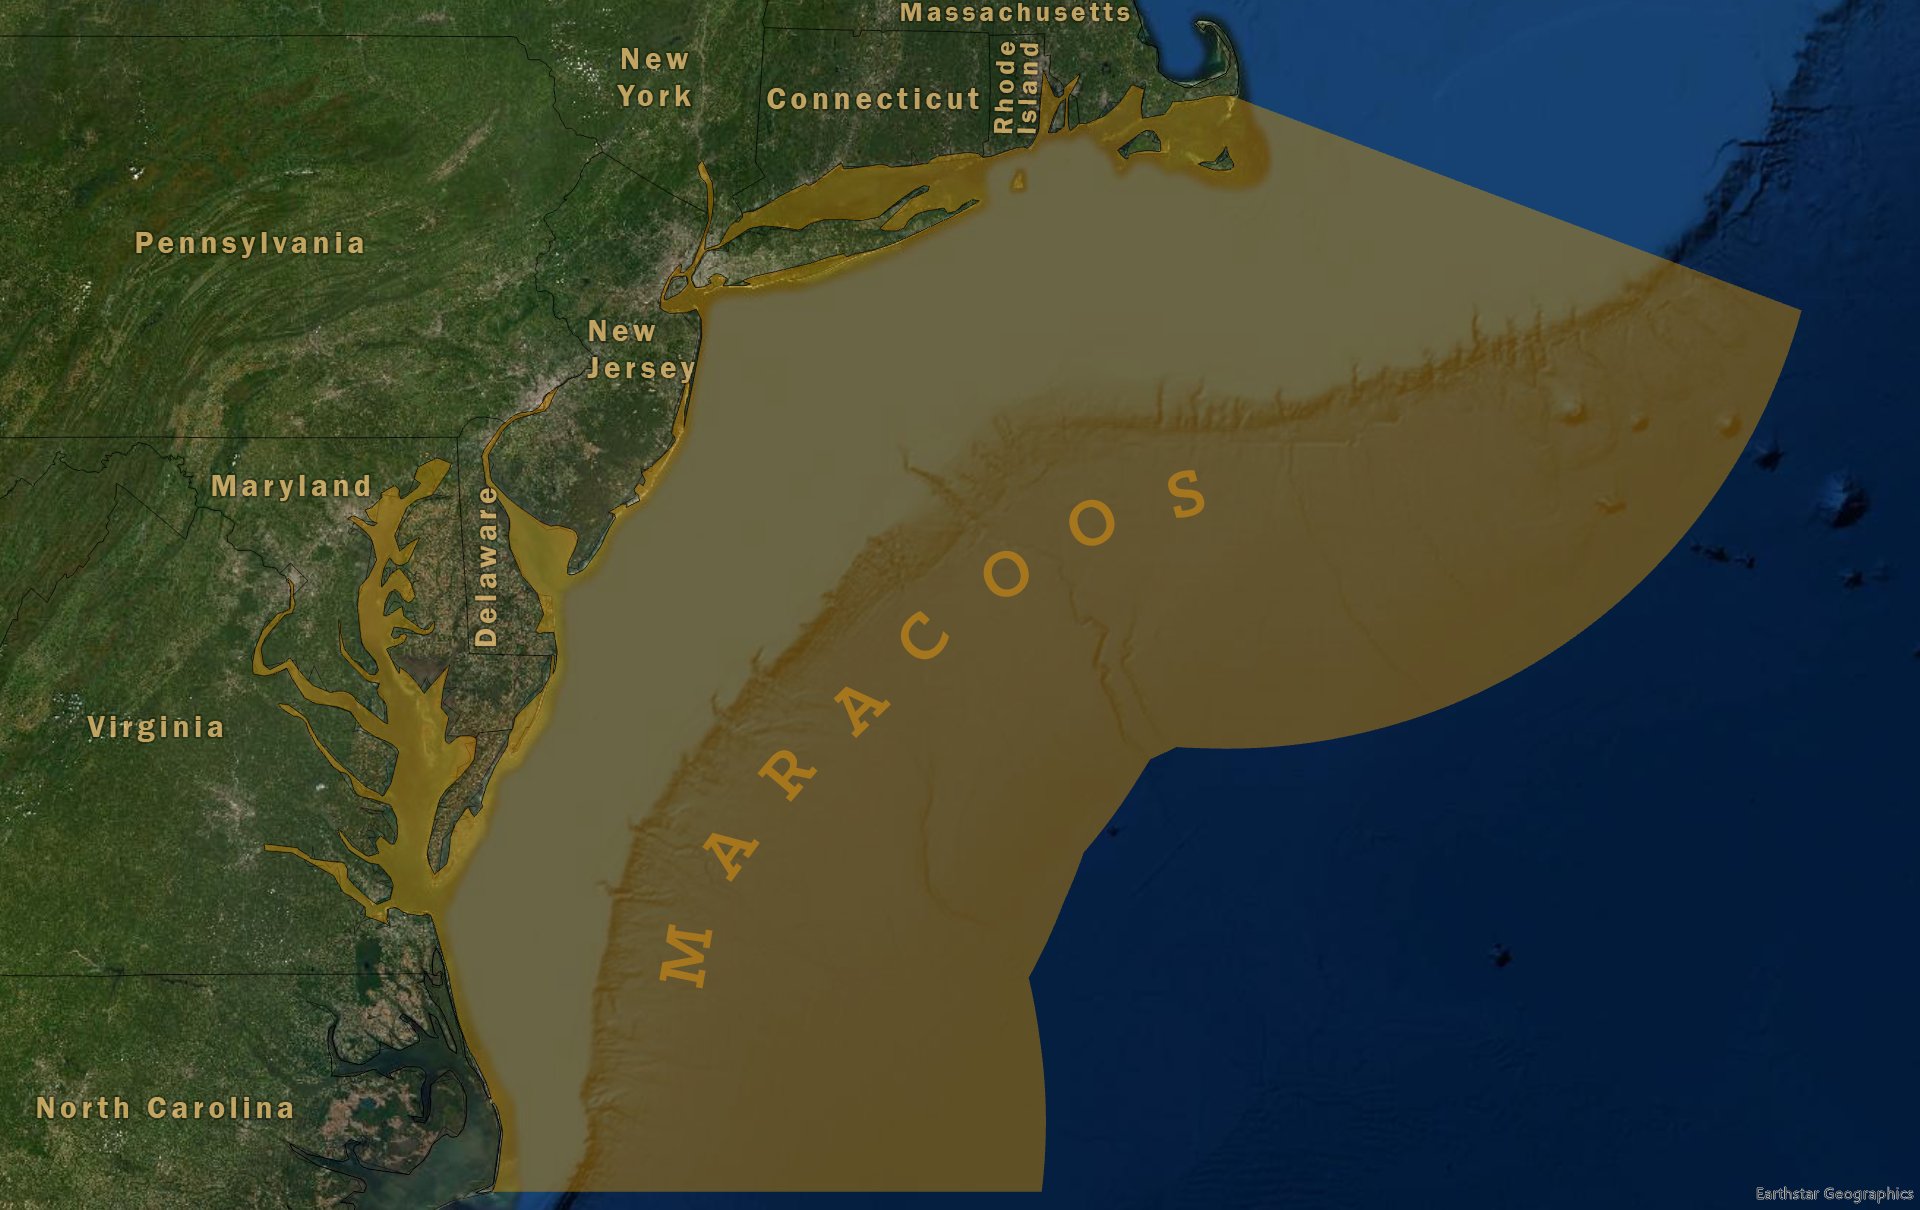
Map of the MARACOOS coverage area from Massachusetts to North Carolina and offshore in the Mid-Atlantic
REGIONAL FOCUSMARACOOS connects the Mid-Atlantic.

The pilot traces evidence across the regional system while preserving the national IOOS context.
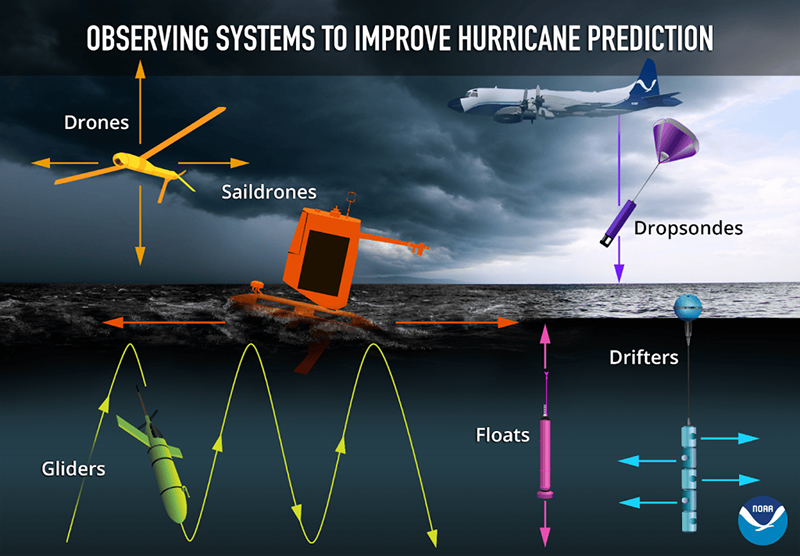
Diagram of drones, saildrones, dropsondes, drifters, floats, and gliders used to improve hurricane prediction
COASTAL HAZARDSMany instruments, one decision system.

Observations become forecasts, warnings, preparedness actions, and ultimately economic consequences.
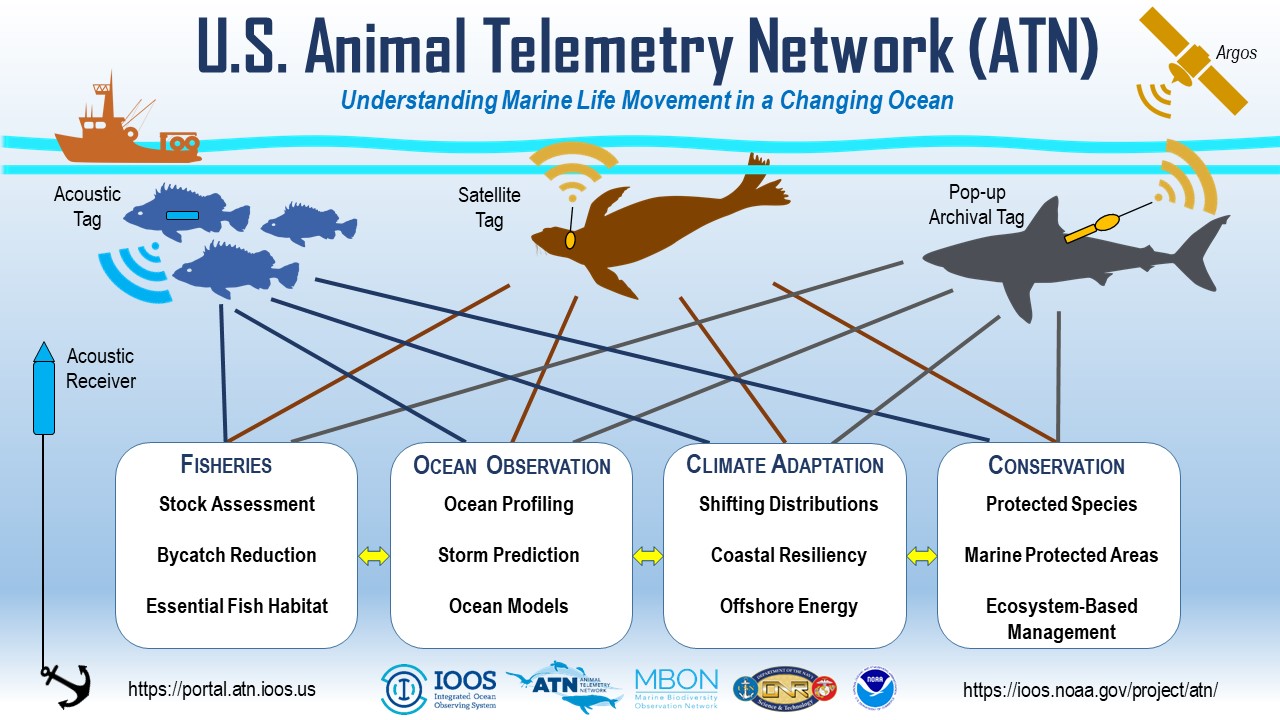
Diagram of the U.S. Animal Telemetry Network and applications for fisheries, ocean observation, climate adaptation, and conservation
MARINE RESOURCESMovement data supports management.

Telemetry helps connect ocean conditions to fisheries, conservation, climate adaptation, and planning decisions.

REGIONAL PARTNERS

One national commons, grounded in place.

Explore the national evidence base or focus on a regional association and the communities it serves.

START WITH THE DECISION

What kind of value are you looking for?

Browse by outcome, then open a record to inspect the evidence behind it.

NATIONAL EVIDENCE EXPLORER

Claims you can inspect—not just accept

151 evidence records shown

ClaimEvidenceAttributionStatus
coastal ocean economyUnder the study's baseline assumptions and 90% forecast accuracy, modeled annual value exceeded the $1.5 million comparison cost when major HAB events occurred more often than once every seven years.Assessing the value of harmful algal bloom forecasts in the Pacific NorthwestYear not listedContextualContextualVerified
water quality public healthThe study estimated household willingness to pay of roughly $40-$45 per year for higher-accuracy versions of an improved 24-hour red-tide respiratory forecast.Harmful Algal Blooms and Toxic Air: The Economic Value of Improved ForecastsYear not listedContextualContextualVerified
water quality public healthA stated-preference choice experiment estimated that southwest Florida households would pay about $17 per year for even the basic version of an improved 24-hour red-tide respiratory forecast.Harmful Algal Blooms and Toxic Air: The Economic Value of Improved Forecasts2023ContextualContextualVerified
water quality public healthThe study estimated household willingness to pay of roughly $40-$45 per year for higher-accuracy versions of an improved 24-hour red-tide respiratory forecast.Harmful Algal Blooms and Toxic Air: The Economic Value of Improved Forecasts2023ContextualContextualVerified
maritime transportationThe study attributed up to half of observed reductions in allision, collision, and grounding rates at evaluated locations to PORTS installations.Allisions, Collisions and Groundings: Estimating the Impact of the Physical Oceanographic Real Time System (PORTS(R)) on Accident Reduction2018ContextualContextualVerified
maritime transportationThe study estimated that PORTS installations in place through 2016 generated nearly $21 million per year in gross accident-reduction benefits.Allisions, Collisions and Groundings: Estimating the Impact of the Physical Oceanographic Real Time System (PORTS(R)) on Accident Reduction2018ContextualContextualVerified
maritime transportationExisting PORTS installations were estimated to produce about $180 million in present-value gross accident-reduction savings over a ten-year instrument life.Allisions, Collisions and Groundings: Estimating the Impact of the Physical Oceanographic Real Time System (PORTS(R)) on Accident Reduction2018ContextualContextualVerified
maritime transportationThe study estimated that extending PORTS to 23 additional economically justifiable ports could yield up to $10 million in annual gross accident-reduction savings.Allisions, Collisions and Groundings: Estimating the Impact of the Physical Oceanographic Real Time System (PORTS(R)) on Accident Reduction2018ContextualContextualVerified
maritime transportationThe study estimated more than $84 million in ten-year present-value gross savings from expanding PORTS to 23 additional ports.Allisions, Collisions and Groundings: Estimating the Impact of the Physical Oceanographic Real Time System (PORTS(R)) on Accident Reduction2018ContextualContextualVerified
maritime transportationA NOAA Precision Navigation demonstration at Los Angeles/Long Beach supported an increase in the permitted maximum tanker draft from 65 to 69 feet.New NOAA precision navigation program increases safety, efficiency for maritime commerce2018ContextualContextualVerified
maritime transportationNOAA reported that each additional foot of safe tanker draft at Los Angeles/Long Beach represented about $2 million in additional product per transit.New NOAA precision navigation program increases safety, efficiency for maritime commerce2018ContextualContextualVerified
maritime transportationNOAA estimated that the increased draft allowance enabled by its Los Angeles/Long Beach Precision Navigation demonstration reduced lightering costs by about $10 million per year.New NOAA precision navigation program increases safety, efficiency for maritime commerce2018ContextualContextualVerified
ocean technologyBy 2010, IOOS supported standardized national delivery of hourly surface-current data from more than 100 HF radars operated by 30 institutions.The Integrated Ocean Observing System High-Frequency Radar Network: Status and Local, Regional, and National Applications2010ContextualContextualVerified
emergency response sarA Mid-Atlantic SAROPS comparison reported a two-thirds smaller search area after 96 hours when HF radar data were used, and the data entered operational Coast Guard planning in May 2009.The Integrated Ocean Observing System High-Frequency Radar Network: Status and Local, Regional, and National Applications2010ContextualContextualVerified
coastal hazards resilienceDuring the 2007 Cosco Busan spill, HF radar trajectories closely matched observed shoreline oil locations and correctly indicated that oil entering the Gulf of the Farallones would not beach there.The Integrated Ocean Observing System High-Frequency Radar Network: Status and Local, Regional, and National Applications2010ContextualContextualVerified
coastal hazards resilienceIOOS-delivered Gulf HF radar data supported daily NOAA spill-response operations for the Deepwater Horizon event through at least August 2010.The Integrated Ocean Observing System High-Frequency Radar Network: Status and Local, Regional, and National Applications2010ContextualContextualVerified
water quality public healthDuring the 2006 Hyperion outfall diversion, real-time HF radar currents were used to adapt the sampling grid for tracking an approximately 800-million-gallon treated-wastewater plume.The Integrated Ocean Observing System High-Frequency Radar Network: Status and Local, Regional, and National Applications2010ContextualContextualVerified
maritime transportationNOAA estimated that PORTS installations serving 58 major ports generated about $217.4 million in annual benefits in 2010 dollars.Scoping Study to Assess the Value of the Physical Oceanographic Real-Time System to the U.S. Economy2013ContextualContextualVerified
maritime transportationThe NOAA study estimated a ten-year present value of about $1.779 billion for benefits from the 58 PORTS-served ports existing in 2010.Scoping Study to Assess the Value of the Physical Oceanographic Real-Time System to the U.S. Economy2013ContextualContextualVerified
maritime transportationNOAA estimated approximately $82.6 million in additional annual benefits from expanding PORTS to 117 major ports not served in 2010.Scoping Study to Assess the Value of the Physical Oceanographic Real-Time System to the U.S. Economy2013ContextualContextualVerified
maritime transportationThe study estimated that universal PORTS coverage across the top 175 U.S. ports could provide about $300 million annually in 2010-dollar benefits.Scoping Study to Assess the Value of the Physical Oceanographic Real-Time System to the U.S. Economy2013ContextualContextualVerified
maritime transportationNOAA?s preferred method estimated about $119.65 million per year in cargo-capacity benefits at the 58 PORTS-served ports existing in 2010.Scoping Study to Assess the Value of the Physical Oceanographic Real-Time System to the U.S. Economy2013ContextualContextualVerified
maritime transportationThe NOAA assessment estimated approximately $76.4 million annually in reduced commercial-vessel transit-delay benefits from PORTS existing in 2010.Scoping Study to Assess the Value of the Physical Oceanographic Real-Time System to the U.S. Economy2013ContextualContextualVerified
coastal hazards resilienceNOAA estimated about $3.5 million annually in oil-pollution-remediation benefits from PORTS installations existing in 2010.Scoping Study to Assess the Value of the Physical Oceanographic Real-Time System to the U.S. Economy2013ContextualContextualVerified
maritime transportationNOAA estimated approximately $5.2 million annually in avoided commercial-marine-accident property damage attributable to the PORTS network existing in 2010.Scoping Study to Assess the Value of the Physical Oceanographic Real-Time System to the U.S. Economy2013ContextualContextualVerified
maritime transportationThe NOAA assessment estimated approximately $11.8 million annually in morbidity-and-mortality benefits from reduced commercial marine accidents at PORTS-served locations.Scoping Study to Assess the Value of the Physical Oceanographic Real-Time System to the U.S. Economy2013ContextualContextualVerified
maritime transportationThe NOAA scoping study reported a 59% reduction in grounding rates and a 33% reduction in overall commercial marine accident rates associated with PORTS locations.Scoping Study to Assess the Value of the Physical Oceanographic Real-Time System to the U.S. Economy2013ContextualContextualVerified
emergency response sarRutgers estimates that Coast Guard use of MARACOOS surface-current products saves approximately $16 million per year in search costs.Ocean Surface Current RadarYear not listedContextualContextualVerified
ocean technologyIn 2010, the peer-reviewed MARCOOS network description reported 27 HF-radar sites and consistent operational coverage from Cape Cod to Cape Hatteras.Operation and Application of a Regional High-Frequency Radar Network in the Mid-Atlantic Bight2010ContextualContextualVerified
emergency response sarA MARCOOS validation comparison found that optimal interpolation raised drifter-comparison coverage from 53% to 65% with about a 1–2 cm/s RMS uncertainty increase, supporting its selection for operational SAROPS delivery.Operation and Application of a Regional High-Frequency Radar Network in the Mid-Atlantic Bight2010ContextualContextualVerified
emergency response sarIn a four-day MARCOOS SAROPS case study, HF-radar currents produced a 12,000 km² search area versus 36,000 km² with HYCOM—a two-thirds reduction—and the HF-radar area was centered on the actual drifter.Operation and Application of a Regional High-Frequency Radar Network in the Mid-Atlantic Bight2010ContextualContextualVerified
fisheries aquacultureThe paper demonstrated a MARCOOS HF-radar application for summer-flounder management research, finding common transport endpoints and a 3–5 week transport timescale across three spawning regions.Operation and Application of a Regional High-Frequency Radar Network in the Mid-Atlantic Bight2010ContextualContextualVerified
ocean technologyAs of the 2024 publication, MARACOOS reported operating 38 real-time HF radars and supplying surface-current measurements to the U.S. Coast Guard continuously since May 2009.Real-time quality assurance and quality control for a high frequency radar network2024ContextualContextualVerified
emergency response sarAdditional MARACOOS QA/QC improved or preserved six-hour drifter-track skill in seven of eight reported cases, including a rise from 0.21 to 0.47 for one Outer Banks drifter.Real-time quality assurance and quality control for a high frequency radar network2024ContextualContextualVerified
emergency response sarMARACOOS reports that its HF-radar surface-current network can reduce Coast Guard search areas by two-thirds.MARACOOS in New JerseyYear not listedContextualContextualVerified
coastal hazards resilienceIntegrated MARACOOS observations documented that most Mid-Atlantic shelf cooling during Irene occurred before eye passage, including 3.8–6.3 °C at buoys and 5.1 °C at the glider.Stratified coastal ocean interactions with tropical cyclones2016ContextualContextualVerified
coastal hazards resilienceThe study found the pre-eye cooling mechanism in all 11 qualifying Mid-Atlantic storms from 1985–2015, averaging 2.7 ± 1.3 °C and 73% of in-storm cooling.Stratified coastal ocean interactions with tropical cyclones2016ContextualContextualVerified
ocean technologyThe multi-region U.S. hurricane-glider program scaled to more than 280 deployments, nearly 600,000 profiles, and 13,000 glider-days during 2018–2021, sampling more than 30 Atlantic cyclones.Uncrewed Ocean Gliders and Saildrones Support Hurricane Forecasting and Research2021ContextualContextualVerified
coastal hazards resilienceThe article documents an operational observing-to-forecast pathway in which IOOS DAC glider profiles reach NOAA models through the Global Telecommunication System in real time.Uncrewed Ocean Gliders and Saildrones Support Hurricane Forecasting and Research2021ContextualContextualVerified
coastal hazards resilienceA cited Hurricane Maria study found gliders delivered the largest local intensity-forecast error reduction among the tested in situ ocean observing platforms.Uncrewed Ocean Gliders and Saildrones Support Hurricane Forecasting and Research2021ContextualContextualVerified
coastal hazards resilienceFor Hurricane Gonzalo, assimilating CARICOOS glider profiles reduced local tropical cyclone heat-potential error from 31% to 6% and captured a 20 m salinity-driven barrier layer absent without glider data.Impact of Assimilating Underwater Glider Data on Hurricane Gonzalo (2014) Forecasts2017ContextualContextualVerified
coastal hazards resilienceAssimilated glider profiles materially reduced 48-hour upper-ocean temperature and salinity errors near Hurricane Gonzalo, with the all-observation experiment performing best.Impact of Assimilating Underwater Glider Data on Hurricane Gonzalo (2014) Forecasts2017ContextualContextualVerified
coastal hazards resilienceIn the Gonzalo case, gliders added a modest incremental improvement when combined with broad standard observations, but glider data alone did not significantly improve intensity.Impact of Assimilating Underwater Glider Data on Hurricane Gonzalo (2014) Forecasts2017ContextualContextualVerified
coastal hazards resilienceIn the Hurricane Nicholas case, the P2M framework generated a single-lead flood-depth map in 4 seconds on one CPU core versus 16 minutes on 480 cores for a six-hour numerical-model run, a reported 115,200-fold CPU-time efficiency gain.A machine learning-based prediction-to-map framework for rapid and accurate spatial flood prediction2025ContextualContextualVerified
coastal hazards resilienceFor Hurricane Nicholas, P2M's one- to six-hour maps closely reproduced the numerical model across the study area (NSE >0.98; RMSE 0.26–0.29 m), with average peak depths 0.15–0.24 m higher.A machine learning-based prediction-to-map framework for rapid and accurate spatial flood prediction2025ContextualContextualVerified
coastal hazards resilienceAgainst observations at two withheld locations during Hurricane Nicholas, P2M reduced RMSE by 0.10 m and 0.09 m relative to the numerical model; R² improved by 0.06 at one site and was unchanged at the other.A machine learning-based prediction-to-map framework for rapid and accurate spatial flood prediction2025ContextualContextualVerified
coastal hazards resilienceThe demonstrated P2M configuration used ten years of hourly NOAA/USGS observations and produced evaluated one- to six-hour forecasts; uncertainty increased substantially beyond six hours.A machine learning-based prediction-to-map framework for rapid and accurate spatial flood prediction2025ContextualContextualVerified
coastal hazards resilienceAn LSU promotional article claims a four-second laptop runtime for a 72-hour flood simulation versus 15 minutes on a supercomputer.LSU's near-instant flood predictions could save lives2025ContextualContextualVerified
coastal hazards resilienceLSU's promotional article claims 20–40% greater water-level prediction accuracy than traditional methods.LSU's near-instant flood predictions could save lives2025ContextualContextualVerified
coastal hazards resilienceThe LSU article identifies infrastructure control and emergency-resource dispatch as prospective decision uses for rapid flood forecasts.LSU's near-instant flood predictions could save lives2025ContextualContextualVerified
coastal hazards resilienceThe IOOS-led 2025 hurricane campaign coordinated 79 missions totaling 3,932 glider-days across the principal U.S. tropical-cyclone basins.Hurricane Glider Coordination: A 2025 Retrospective2026ContextualContextualVerified
coastal hazards resilienceMore than 90,000 glider temperature/salinity profiles moved through the IOOS GDAC and NOAA NDBC in 2025 for use in NOAA models.Hurricane Glider Coordination: A 2025 Retrospective2026ContextualContextualVerified
coastal hazards resilienceNOAA IOOS reports that Rutgers comparisons found glider assimilation improved RTOFS temperature and salinity fields and informed motivation for the RTOFS 2.5 upgrade.Hurricane Glider Coordination: A 2025 Retrospective2026ContextualContextualVerified
coastal hazards resilienceNOAA IOOS summarizes selected studies as showing up to 30–50% improvement in hurricane-intensity prediction accuracy from ocean observations including gliders.Hurricane Glider Coordination: A 2025 Retrospective2026ContextualContextualVerified
coastal hazards resiliencePacIOOS provides an hourly updated, six-day wave-run-up forecast for 12 West Maui shoreline regions to support advance planning for flooding and erosion.Wave Run-Up Forecast: West Maui, HawaiʻiYear not listedContextualContextualVerified
coastal hazards resiliencePacIOOS reports close spectral and coherence agreement between BOSZ output and field observations for two selected 2018–2019 Kahana wave events.Wave Run-Up Forecast: West Maui, Hawaiʻi2019ContextualContextualVerified
coastal hazards resiliencePacIOOS translates West Maui run-up forecasts into three local impact categories, supported by historical/citizen photographs and optional threshold notifications.Wave Run-Up Forecast: West Maui, HawaiʻiYear not listedContextualContextualVerified
coastal hazards resilienceNOAA reports that IOOS-supported HF radars and gliders used in the Hurricane Maria response functioned as expected throughout the storm.Hurricane Maria: NOS Fiscal Year 2017 Year in ReviewYear not listedContextualContextualVerified
coastal hazards resilienceA CARICOOS buoy displaced by Hurricane Maria continued transmitting and was recovered 420 nautical miles from its mooring location.Hurricane Maria: NOS Fiscal Year 2017 Year in ReviewYear not listedContextualContextualVerified
coastal hazards resilienceAn IOOS Modeling Testbed configuration supplied reef-island surge and inundation forecast information that NHC shared with FEMA for Hurricane Maria response preparation.Hurricane Maria: NOS Fiscal Year 2017 Year in ReviewYear not listedContextualContextualVerified
coastal hazards resilienceDuring the 2017 response period, Puerto Rico was added to the national storm-surge hazard-map capability, enabling four- to seven-day hurricane-impact forecasts.Hurricane Maria: NOS Fiscal Year 2017 Year in ReviewYear not listedContextualContextualVerified
maritime transportationNOAA emergency hydrography identified submerged containers and shoaling and supported post-Maria port-reopening decisions in Puerto Rico and the U.S. Virgin Islands.Hurricane Maria: NOS Fiscal Year 2017 Year in ReviewYear not listedContextualContextualVerified
coastal hazards resilienceNOAA posted more than 12,000 post-Maria images covering over 1,500 km² within hours for response and recovery uses.Hurricane Maria: NOS Fiscal Year 2017 Year in ReviewYear not listedContextualContextualVerified
coastal ocean economyStudies summarized by the 2000 panel placed the potential annual value of ENSO information to U.S. agriculture in the hundreds of millions of dollars, but the estimates may overlap and are not incremental ISOOS benefits.The Economics of Sustained Ocean Observations: Benefits and Rationale for Public Funding2000ContextualContextualVerified
coastal ocean economyA study summarized by the panel estimated a 13%-26% real internal rate of return for TOGA/ENSO observing investments from agricultural benefits alone, above the cited 7% federal hurdle rate.The Economics of Sustained Ocean Observations: Benefits and Rationale for Public Funding2000ContextualContextualVerified
fisheries aquacultureA fishery-management study summarized by the panel estimated more than $1 million per year in net benefits, nearly 10% of landed value, from ENSO-informed management of one small northwestern Coho fishery.The Economics of Sustained Ocean Observations: Benefits and Rationale for Public Funding2000ContextualContextualVerified
maritime transportationThe 2000 panel reported broad commercial use of weather routing and cited an estimate of roughly $300 million per year in transportation-cost savings from those services.The Economics of Sustained Ocean Observations: Benefits and Rationale for Public Funding2000ContextualContextualVerified
coastal ocean economyPreliminary work summarized by the panel placed the potential annual value of improved marine forecasts to recreational boaters in the tens of millions of dollars.The Economics of Sustained Ocean Observations: Benefits and Rationale for Public Funding2000ContextualContextualVerified
emergency response sarA preliminary coastal-forecast analysis summarized by the panel estimated that an approximately 1% improvement in U.S. search efficiency could yield more than $100 million per year in life and property benefits.The Economics of Sustained Ocean Observations: Benefits and Rationale for Public Funding2000ContextualContextualVerified
coastal ocean economyThe report documents a large beach-recreation value base that improved coastal information could help protect, but it does not quantify the share attributable to better observations or shorter closures.The Economics of Sustained Ocean Observations: Benefits and Rationale for Public Funding2000ContextualContextualVerified
coastal ocean economyUnder the study's baseline assumptions and 90% forecast accuracy, modeled annual value exceeded the $1.5 million comparison cost when major HAB events occurred more often than once every seven years.Assessing the value of harmful algal bloom forecasts in the Pacific Northwest2024ContextualContextualVerified
fisheries aquacultureThe study estimated an average annual economic-activity base of $191.9 million in 2023 dollars across the two modeled Pacific Northwest fisheries.Assessing the value of harmful algal bloom forecasts in the Pacific Northwest2024ContextualContextualVerified
fisheries aquacultureThe model used a $100.1 million large-HAB loss base and assumed forecast-informed responses mitigate 15% of that loss, with false responses costing 2% of no-HAB fishery value.Assessing the value of harmful algal bloom forecasts in the Pacific Northwest2024ContextualContextualVerified
water quality public healthThe Bulletin was integrated into state sampling and harvest decisions, with four to eight seasonal assessments and a cited 91.7% detection probability for 2017-2022.Assessing the value of harmful algal bloom forecasts in the Pacific Northwest2024ContextualContextualVerified
emergency response sarCoast Guard and IOOS officials reported that adding HF-radar currents to SAROPS assessments could reduce modeled search areas by 66%.Coast Guard Adopts a High-Frequency Solution2013ContextualContextualVerified
emergency response sarIOOS/NOAA HF-radar currents were used in the Coast Guard's Bounty search during Sandy, in which 14 of 16 crewmembers were rescued.Coast Guard Adopts a High-Frequency Solution2013ContextualContextualVerified
coastal hazards resilienceThree Gulf Coast HF radars supplied operational surface-current checks for Deepwater Horizon spill-transport modeling.Coast Guard Adopts a High-Frequency Solution2013ContextualContextualVerified
coastal ocean economyRutgers reports that Mid-Atlantic ports handle 25% of U.S. waterborne commerce, providing context for the maritime activity that MARACOOS information helps support.MARACOOS Supporting Maritime Commerce and SafetyYear not listedContextualContextualVerified
emergency response sarThe U.S. Coast Guard uses Rutgers Doppio surface-current predictions to support search-target trajectory planning in the Mid-Atlantic Bight.MARACOOS Supporting Maritime Commerce and SafetyYear not listedContextualContextualVerified
emergency response sarMARACOOS HF-radar observations have supplied Coast Guard search planning since May 2009 and feed 24-hour Mid-Atlantic surface-current predictions.MARACOOS Supporting Maritime Commerce and Safety2009ContextualContextualVerified
maritime transportationNOAA National Ocean Service uses HF-radar observations to enhance PORTS navigation products in New York Harbor and Chesapeake Bay.MARACOOS Supporting Maritime Commerce and SafetyYear not listedContextualContextualVerified
coastal hazards resilienceNational Weather Service forecast offices use MARACOOS-related data in AWIPS2 and nearshore wave-prediction systems.MARACOOS Supporting Maritime Commerce and SafetyYear not listedContextualContextualVerified
maritime transportationA NOAA and U.S. IOOS partnership made near-real-time HF-radar surface-current observations available to mariners in New York Harbor.Now Online: High Frequency Radar Data Enhances NavigationYear not listedContextualContextualVerified
maritime transportationNOAA reported that its IOOS-partnered HF-radar product complemented PORTS by adding broad spatial surface-current information in New York Harbor and Chesapeake Bay.Now Online: High Frequency Radar Data Enhances NavigationYear not listedContextualContextualVerified
fisheries aquacultureMARACOOS-supported CBEFS provides Chesapeake Bay anglers with nowcasts and five-day forecasts used to plan around low oxygen and harmful algal blooms.Chesapeake Bay Anglers Use CBEFS Forecasts to Avoid Bad Water and Plan Smarter TripsYear not listedContextualContextualVerified
fisheries aquacultureOne Chesapeake Bay charter captain reported using CBEFS hypoxia forecasts to expand his set of alternative client fishing locations from six to nine.Chesapeake Bay Anglers Use CBEFS Forecasts to Avoid Bad Water and Plan Smarter TripsYear not listedContextualContextualVerified
fisheries aquacultureChesapeake Bay anglers reported using CBEFS to change fishing locations and avoid unnecessary travel and fuel use.Chesapeake Bay Anglers Use CBEFS Forecasts to Avoid Bad Water and Plan Smarter TripsYear not listedContextualContextualVerified
water quality public healthCBEFS supports Chesapeake Bay operational decisions involving aquaculture, harmful algal blooms, acidification, and potential sea-nettle impacts on power-plant intakes.Chesapeake Bay Anglers Use CBEFS Forecasts to Avoid Bad Water and Plan Smarter TripsYear not listedContextualContextualVerified
water quality public healthMARACOOS and NYSDEC support continuous water-quality monitoring at 17 Hudson and Mohawk River sites with observations every 15 minutes.MARACOOS in New YorkYear not listedContextualContextualVerified
coastal hazards resilienceMARACOOS CHARM shares real-time coastal-risk information to support New York preparedness decisions.MARACOOS in New YorkYear not listedContextualContextualVerified
maritime transportationA 2001 Gulf of Maine scoping study modeled approximately $500,000 in annual vessel-cost savings from a 1% improvement in transit times enabled by better marine information.The Potential Economic Benefits of Coastal Ocean Observing Systems: The Gulf of Maine2001ContextualContextualVerified
fisheries aquacultureThe study used an estimated $4.15 million in combined New England fishery value added per fishing day to illustrate the scale of decisions that better ocean information could affect.The Potential Economic Benefits of Coastal Ocean Observing Systems: The Gulf of Maine2001ContextualContextualVerified
fisheries aquacultureA 2001 study modeled a $4.245 million recreational-fishing value from a hypothetical 1% increase in Gulf of Maine trips associated with better information.The Potential Economic Benefits of Coastal Ocean Observing Systems: The Gulf of Maine2001ContextualContextualVerified
emergency response sarThe Gulf of Maine study modeled that a one-percentage-point SAR-effectiveness improvement could correspond to six additional lives saved annually, valued at about $24 million under its assumptions.The Potential Economic Benefits of Coastal Ocean Observing Systems: The Gulf of Maine2001ContextualContextualVerified
fisheries aquacultureROFFS uses satellite, buoy, and other ocean observations to help commercial fishers choose productive areas and avoid unproductive travel.Commercial Fishing AnalysesYear not listedContextualContextualVerified
fisheries aquacultureROFFS reports that some Spanish tuna purse-seine clients stopped using helicopter spotting after adopting its fishing analyses.Commercial Fishing AnalysesYear not listedContextualContextualVerified
maritime transportationWeatherFlow incorporates U.S. IOOS data into commercial high-resolution weather products.National IOOS CommunityYear not listedContextualContextualVerified
water quality public healthIOOS and its Regional Associations contribute to the National Water Quality Monitoring Network's integrated coastal and tributary observations.National IOOS CommunityYear not listedContextualContextualVerified
fisheries aquacultureU.S. IOOS data support the design, monitoring, and assessment of marine protected areas.National IOOS CommunityYear not listedContextualContextualVerified
fisheries aquacultureCommercial and recreational fisheries generated $5.5 billion in 2022 sales across Mid-Atlantic Council member states.New Infographics Highlight the Value of Mid-Atlantic Fisheries2025ContextualContextualVerified
fisheries aquacultureCommercial and recreational fisheries supported nearly 59,000 jobs across Mid-Atlantic Council member states in 2022.New Infographics Highlight the Value of Mid-Atlantic Fisheries2025ContextualContextualVerified
coastal ocean economyA University of Delaware study reported that Delaware's coastal economy grew five times faster than the rest of the state from 2011 to 2022.University of Delaware & Delaware Sea Grant Coastal Economy Report2024ContextualContextualVerified
coastal ocean economyDelaware coastal industries employed 74,030 people in the state's coastal infrastructure zone in 2022.University of Delaware & Delaware Sea Grant Coastal Economy Report2024ContextualContextualVerified
coastal ocean economyDelaware coastal industries generated $4.1 billion in employee income in 2022.University of Delaware & Delaware Sea Grant Coastal Economy Report2024ContextualContextualVerified
coastal ocean economyDelaware coastal industries generated $14.2 billion in total revenue in 2022.University of Delaware & Delaware Sea Grant Coastal Economy Report2024ContextualContextualVerified
coastal ocean economyThe study estimated that each $100 in Delaware coastal-region revenue supports another $59 statewide, equivalent to $8.3 billion annually.University of Delaware & Delaware Sea Grant Coastal Economy Report2024ContextualContextualVerified
coastal ocean economyThe study attributed more than $3.3 billion in annual tax revenue to Delaware coastal activity and its broader economic effects.University of Delaware & Delaware Sea Grant Coastal Economy Report2024ContextualContextualVerified
TRANSPARENCY BY DESIGN

A claim is only as useful as its chain of evidence.

01SourceOriginal publication and stable link
02ExtractMetric, context, and precise language
03ReviewEvidence and IOOS attribution scored separately
04UseApproved claim, limits, and report eligibility